Introduction️
Nordic nRF51 is a series of system-on-a-chip (SoC) developed by Nordic Semiconductor. These chips are designed specifically for low power and low energy applications in the field of wireless connectivity. The nRF51 series includes several models, such as the nRF51822 and the nRF51802, among others.️
These chips are widely used in low-power devices, such as wearables, IoT sensors (Internet of Things), health devices, and other devices that require efficient connectivity and minimal energy consumption. In the case that we need to perform a reverse engineering analysis on some of these devices it will be necessary to obtain a copy of the firmware from the chip itself of the device.️
For this purpose we will use a CMSIS-DAP debugger type, which is a protocol specification and an implementation of firmware that allows access to the debug port (DAP) CoreSight of an ARM Cortex microcontroller through USB, in this case SWD (Serial Wire Debug). As specialized hardware is required, we can use a Flipper Zero, or a development board. There are more economical solutions available on the market, but in this case the Flipper Zero will be used.️
Preparing the environment️
First we need to locate on the device to copy the chip used, in this case the nRF51822, so we take its specifications. Now we need to locate the three necessary ports to connect to the debugger: SWDIO (pin 23), SWDCLK (pin 24), and GND (pin 13). This photo illustrates the pins.️
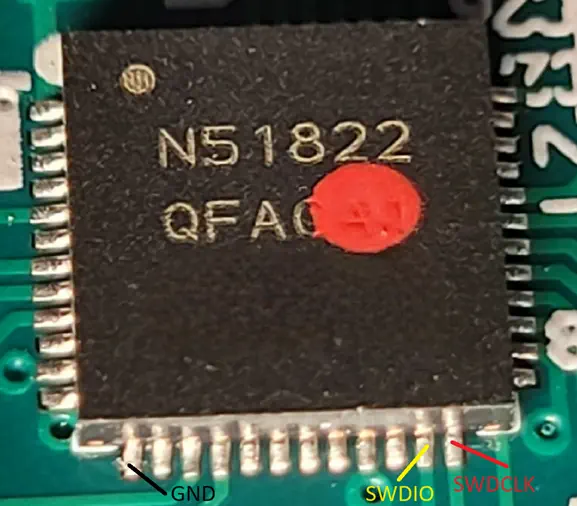 If we’re lucky, the pins will have a trace on the PCB and end at a test point where we’ll need to solder the wire or even end in a type Dupont connector. In the worst case, we’ll have to solder a very thin cable to the chip’s pin due to its small size.️
Debugger connection️
We can use two options as a debugger: The Flipper Zero itself or its development board. We will analyze both options.️
Option 1: Connecting the debugger to Flipper Zero️
Having access to the debugging ports, we can proceed with the connection. For the Flipper Zero, we will connect the SWDCLK pin to pin 2-A7, the GND pin to 8-GND, and the SWDIO pin to pin 3-A6. More information about the GPIO of the Flipper Zero is available in its documentation. After installing the application DAP Link, we will open it and connect the Flipper Zero to our computer.️
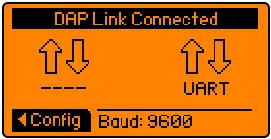 It will be recognized as a CMSIS-DAP device.️
Option 2: Connecting the debugger to the development board️
Having access to the debugging ports, we can establish a connection. In the case of the Flipper Zero, we will connect the SWDCLK pin to pin 10-IO1, the GND pin to 11-GND, and the SWDIO pin to pin 12-IO2. We have more information about the GPIO of the Flipper Zero development board in its documentation. We need to have the original firmware BlackMagic installed on the board.️
When we connect the board via USB-C, it will create an access point to which we will connect in order to access its configuration page http://blackmagic.local. We will change the USB mode option from BlackMagicProbe to DapLink and then reboot the board.️
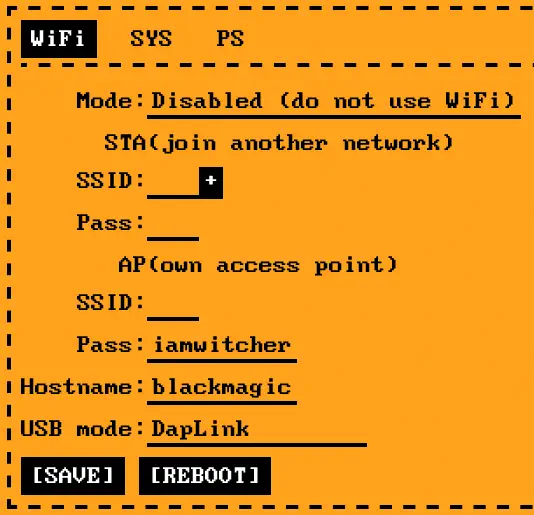 Now on our computer the board will be recognized as a CMSIS-DAP device.️
$ lsusb
Bus 001 Device 001: ID 1d6b:0002 Linux Foundation 2.0 root hub
Bus 002 Device 004: ID 303a:4002 CMSIS-DAP CMSIS-DAP ESP32S2 Device
Bus 002 Device 003: ID 0e0f:0002 VMware, Inc. Virtual USB Hub
Bus 002 Device 002: ID 0e0f:0003 VMware, Inc. Virtual Mouse
Bus 002 Device 001: ID 1d6b:0001 Linux Foundation 1.1 root hub
Connecting the Debugger with OpenOCD
OpenOCD (Open On-Chip Debugger) is an open source tool designed to provide debugging and programming support for a wide range of embedded devices. In the case that we do not have it installed, we can install it thus in the Linux Debian operating systems.️
$ sudo apt install openocd
We execute the program with two options -f that specify the configuration files for OpenOCD to use, the first one referred to the CMSIS-DAP debugger and the second one to the nRF51 chip.️
$ openocd -f /usr/share/openocd/scripts/interface/cmsis-dap.cfg -f /usr/share/openocd/scripts/target/nrf51.cfg
Open On-Chip Debugger 0.12.0
Licensed under GNU GPL v2
For bug reports, read
        http://openocd.org/doc/doxygen/bugs.html
Info : auto-selecting first available session transport "swd". To override use 'transport select <transport>'.
Info : Listening on port 6666 for tcl connections
Info : Listening on port 4444 for telnet connections
Info : Using CMSIS-DAPv2 interface with VID:PID=0x303a:0x4002, serial=DAP
Info : CMSIS-DAP: SWD supported
Info : CMSIS-DAP: FW Version = 2.0.0
Info : CMSIS-DAP: Interface Initialised (SWD)
Info : SWCLK/TCK = 0 SWDIO/TMS = 0 TDI = 0 TDO = 0 nTRST = 0 nRESET = 0
Info : CMSIS-DAP: Interface ready
Info : clock speed 1000 kHz
Info : SWD DPIDR 0x0bb11477
Info : [nrf51.cpu] Cortex-M0 r0p0 processor detected
Info : [nrf51.cpu] target has 4 breakpoints, 2 watchpoints
Info : starting gdb server for nrf51.cpu on 3333
Info : Listening on port 3333 for gdb connections
With the output [nrf51.cpu] Cortex-M0 r0p0 processor detected we check that the connection is correct, if the output were Error: Error connecting DP: cannot read IDR it would mean that the connection is incorrect. Now we can control the OpenOCD command line by making a telnet connection to port 4444.️
$ telnet localhost 4444
nRF51 chip memory dump
Now that we have access to the OpenOCD command line and a good connection with the chip, we can get the memory address of the code currently running on the microprocessor using the flash banks command.️
> flash banks

#0 : nrf51.flash (nrf51) at 0x00000000, size 0x00040000, buswidth 1, chipwidth 1
#1 : nrf51.uicr (nrf51) at 0x10001000, size 0x00000000, buswidth 1, chipwidth 1
The flash memory starts at the memory address 0x0 and has a size of 0x40000 bytes, so it ends at the memory address 0x40000. Before copying the memory we will stop the processor execution so that it does not interrupt the copy, with the command reset halt.️
> reset halt
Now we can start the firmware copy using the dump_image command with parameters file name, initial memory address and size.️
> dump_image firmware.bin 0x0 0x40000
After a few seconds we will have the firmware copy in the firmware.bin file. It is recommended to perform this process twice and compare the files in case the copy was not done correctly. When opening the file in a hexadecimal editor, two cases may occur:️
We can find a file with high entropy, that is to say, with executable assembler code in hexadecimal which will mean correct copy or that the whole file is composed by the byte 0x00, which will mean that the chip is protected against memory reading attempts. In the second case we’ll have to use another method to get the firmware copy. After copying we’ll restart the device with the command reset.️
> reset
Protected memory of the nRF51 chip copy️
The nRF51 chip can be configured to deny reading memory from the debug port. This chip has an ARM Cortex-M0 processor, which has a vulnerability that allows arbitrary memory addresses to be read and loaded into a register for final reading. This process is explained in more detail in this article.️
We have a Python program developed by SpiderLabs that makes this task easier. It requires the use of Python version 2.7 and a modification to line 70, as it is not compatible with the latest versions of OpenOCD. The modification changes the line upper() to lower(). Finally, we will run it and have access to the firmware copy in the file out.bin.️
$ python2 nrfdump.py
Open On-Chip Debugger

[*] Reading RBPCONF to establish known memory address / value...
[***] RBPCONF is: 0xffff00ff
[*] Searching for usable instruction...
[*] pc = 0x6d0
[*] pc = 0x6d2
[*] pc = 0x6d4
[***] Known value found in register r4 for pc = 0x6d4
[*] Checking which register is the source...
[*] register: r0
[*] register: r1
[*] register: r2
[*] register: r3
[*] register: r4
[***] Found source register: r4

[***] The state of the game:
Known address: 0x10001004
Known value at the address: 0xffff00ff
Instruction address: 0x6d4
Register in: r4
Register out: r4

[*] Dumping memory (0x0 - 0x40000) to output file: testest.bin ...
0x0: ...
Conclusion️
With the firmware file copied, we can now proceed with its analysis using tools such as Ghidra or IDA Pro.️